
Showing posts with label Stocks. Show all posts
Showing posts with label Stocks. Show all posts
Tuesday, November 27, 2012
Amazon AMZN
Amazon's 237 resistance was broken last Friday. Today AMZN post a doji, signaling indecision. Look to the prior resistance are to turn support around 234-237. Target 250 for next resistance,

Another good short entry point S&P 500
Looks like the past support is turning into resistance around the 141.00 level of the SPY SPDR. Price is being rejected by the 50 EMA as well at 141. Short, target 135.


Monday, November 26, 2012
Flagstar Bancorp Inc. FBC
Flagstar has been on a tear since it's reverse split. They finally turned a profit 2nd quarter of 2012, and reported profit again in 3Q. Looking exhausted on weekly, could fall back to EMA's around 12.50, opening up a good entry point. Over 20 continued upside. Very bullish
 Over 17 continued upside on daily.


Aegion Corp AEGN
Aegion has had a great run since October 2011. Recently price respected the weekly trend line around 17.90.
 Looking at over 20 for a further upside push. Target 22.


Ford Motor Company F
Ford found nice support on the retest of the $10.60 breakout late October. Long and strong
 Good entry position over 11.15 on hourly.
 Long term Head and Shoulders breakout and retest of neckline on weekly. Target $13


Financial SPDR XLF
Really in conflict over XLF. Broken 15.75 support seemed to turn into resistance last week. 20 EMA still over 50 EMA for a bullish bias. I'd like to seem over $16 for longs and under $15.50 for a short gap fill. Negative divergence on weekly.


First Solar, Inc. FSLR
FSLR holding strong today, closing up 3% at $25.53. Seems poised for a breakout over $26. Target $30. Could buy stock straight up or purchase $27 December calls, currently trading for $.73.


Arch Coal Inc. ACI
Looking to re-short ACI on a break of 6.30. Target of 5.75. Also bearish on the S&P 500 as the 1400 support area turns resistance.


Friday, November 23, 2012
Stock Twits
Happy Turkey Day all! Just set up a stock twits account this past week. Great site, you can follow me at @Armst227. Seems to enable me to show my positions more real time. Everyone should check it out.
StockTwits @Armst227
StockTwits @Armst227
Tuesday, November 20, 2012

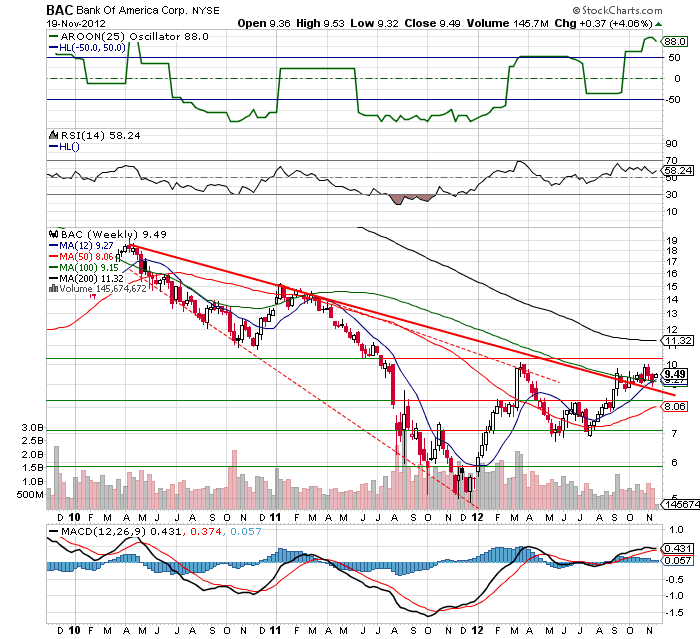
Monday, November 19, 2012
Bank of America BAC
Long over $10.00 for long term.

Vishay Intertechnology Inc, VSH
Bottom calling in Vishay Intertechnology shares around $9.00. Over 9.35 for aggressive long.


Home Depot HD
HD has been on a bullish tear the past year, breaking out over 37.5 in December 2011. Looking for break of 63.50 for continuation. Might take an aggressive short under 59-60.


Sunday, November 18, 2012


Thursday, November 15, 2012
ACI Arch Coal Inc. Short
Almost went long ACI before the election but didn't want to risk it, good thing. False breakout above 8.50. Went short after Obama win, and gap down. In at 7.61 short. More pain to come, targets 6.25, 5.75, and 5.25. Expecting oversold bounce here in the future, presenting another short potential. Recent channel break.


Tuesday, September 11, 2012
Long Term CAT
I give this a FV of 120-130 from my FCF projections. Picked up some more here to double my position.


Monday, April 9, 2012
SPY Options Straddle
I've been dabbling in options for a month or so now, most being paper trades. Here is one i am thinking about currently.
Strategy 1;
Buy 1 April 12 138 Call for $1.25 and Buy 1 April 12th 138 Put for $.71. Max loss $196. Upper BE $140, Lower BE $136.
Strategy 2;
Buy 1 May 12th 138 Call for $3.30 and Buy 1 May 12 138 Put for $2.71. Max loss $601. Upside breakeven is $144 and downside breakeven $132
Strategy 1;
Buy 1 April 12 138 Call for $1.25 and Buy 1 April 12th 138 Put for $.71. Max loss $196. Upper BE $140, Lower BE $136.
Strategy 2;
Buy 1 May 12th 138 Call for $3.30 and Buy 1 May 12 138 Put for $2.71. Max loss $601. Upside breakeven is $144 and downside breakeven $132
Subscribe to:
Posts (Atom)