Wednesday, April 27, 2011

Fidelity National Financial, Inc. (FNF)

Fidelity National has been range trading for the past 2 years now with an upper resistance of $16.  Recently FNF broke out of the $15 resistance.  A retest of the $16 should be expected.  If that level breaks it could signal a nice uptrend to the 2008 levels of around $20.  Currently the P/E ratio sits at 9.43 and a leading P/E of 12.34.  The industry average P/E is 10.86.  If a closer to competitor P/E is obtained this should be trading around $17-$18 a share.  Book value per share is $15.30, bringing the P/B ratio to .97, indicates an undervalued company.  It's important to note Fidelity has a beta of .64, showing lower market risk, and pays out a nice 3.20% dividend.  A break of $16 is key for FNF to move higher.  The earnings announcement tomorrow, 4/28/11, may or may not prove to be a significant catalyst.

via StockCharts.com
"

Eli Lily & Co. (LLY)

Eli Lily broke out of the Oct 2010 highs of $37.20 and closed at $37.23.  LLY P/E ratio is a low 8.46, compared to an industry average of 14.44.  If LLY can manage to pull off a more reasonable 10 P/E, it would be worth approximately $44. Interestingly enough the forward P/E is at 10.04 for 2012.  With a beta of only .80, LLY seems to be less risky than the market.   I believe the $44 target is a reasonable estimate of LLY fair value.  In the short term I expect a pull back to the $36.50 level, due to the RSI being above 70 signaling overbought, before continuing the uptrend.  LLY also offers a 5.40% dividend.

via StockCharts.com
"

Tuesday, April 26, 2011

S&P 500 ($SPX)

S&P 500 broke out of the Feb 2011 high of $1345 today.  We saw a nice bounce off the 50 EMA the past 2 weeks, and should continue it's bull run.  My target is the May 2008 level of $1400.

via StockCharts.com
"

Ford Motor Co. (F)

Ford saw a nice bounce off of it's 200 EMA last week, and is looking to continue it's bullish trend.  If the $16 level can be broken, this thing should re-test the January 2011 highs of $19. 

via StockCharts.com
"

Flagstar Bancorp, Inc. (FBC)

Flagstar Bancorp has been beaten down by heavy non-preforming loan losses, and dilution.  I believe this is an extreme long term value play, and should see massive upside growth in the next 2-3years.   Today Flagstar reported Q1 earnings at a loss of -$.06 per share, compared to a loss of -$.74 in Q1 of 2010.  I believe Flagstar has a chance to breakeven, or report positive earnings next quarter.  Technically Flagstar just broke out of a nasty month and a half downtrend from March 1st. A break of the $1.60 level is essential, and if broken i believe this is a $2 in the short term.  One positive results are shown and some shares can be repurchased, this one will definitely take off in my opinion. 

via StockCharts.com
"

Symmetry Medical Inc. (SMA)

Symmetry Medical seems to be finding support at the $9.85 level.  A breakout above the $10.25 level will be confirmation for a long position.  Target price of $11, and then $12 if the momentum continues. The 50 EMA is above the 100 EMA, which is above the 200 EMA.  Looking very bullish.

via StockCharts.com
"

Rex American Resources Corp. (REX)

REX American resources has a book value per share of $25.18, and currently trades at $16.75.  I believe this is a value play and worth around $20.  It's P/B ratio is a .64.  Technically this looks like it is setting up a long play.  Once the $17 resistance is broken, a nice uptrend should form and take this to the June 2010 high of $19.20.  I believe their is a nice 17-20% upside to this.


via StockCharts.com
"

Monday, April 25, 2011

Whirlpool, Inc. (WHR)

Whirlpool looks like it's finding support at the $87 level after today's close.  I see a further up move to test the $91 high of February 2011 high. A break of this level could suggest a continuation to the $110 level which was the high for 2010.  EPS increased 84% from 09-10 to $7.98, which is right around the 2007 EPS number of 8.01.  Net income increased 88% from 09-10 as well.  I believe this stock is worth around $100.       


via StockCharts.com
"

Microsoft Corp. (MSFT)

Microsoft looks like a bargain here to me.  The stock has found support at the $24.75 level three separate times, twice within the past two months.  This indicates a possible triple bottom pattern.  If the $26.50 level breaks, this will offer some confirmation and possible start to a nice uptrend.  Wall street analyst and hedge funds seem to be bullish on this as well.  My target is $29 for the coming months.  

via StockCharts.com
"

SAIC, Inc. (SAI)

SAIC, Inc. has been in a nice uptrend from the beginning of 2011.  This programming and software company for the US military and intelligence agencies reported a 25% increase in net income last year, and a 30% increase in EPS.  The 100 EMA just recently crossed the 200 EMA.  The pin-bar type price action today shows some support at the $17.00 level. If the recent April high is broken of $17.6, then we should see $18, and possible $20 by year end. 

via StockCharts.com
"

Thursday, April 21, 2011

CitiGroup, Inc. (C)

Citigroup has found support around the $4.39 level.  But still showing signs of a downtrend.  Today's price action tends to favor the trend line resistance holding, so a retest of the 4.39 support should be expected.  Once the downtrend breaks I see a continuation of the bull trend from August 2010.  A bull-wedge formation

via StockCharts.com
"

Excel Maritime Carriers, Ltd. (EXM)

Excel Maritime Carriers EXM has been in a nasty downtrend due to an oversupply of ship carriers and a large decrease in the Baltic Dry Index.  This one I believe is a big value play for the future.  EXM has a book value of around $20/share.  They have gross margins above industry average, and profit margins of 37%.   I think in the near term, if the top channel of the downtrend can be broken this stock should be worth around $8/share.  It's 2009 low of $3/share is where i will be looking for support and a bounce to the upside.  EXM is definitely a watch list stock to add!

via StockCharts.com
"

Financial Select Sector SPDR (XLF)

 GE blew past expectations this morning, further adding to a number of companies showing profits, and further feeding my bull market sentiment.  XLF financial sector spider might be one to start thinking about.  Looks like it has double bottomed around $15.80.  I'll be watching this one closely here in the coming months.  If this can break the downtrend line above around $16.75 then I'm a buyer.  Hopefully we can then blow past the recent and April 2010 $17.14 highs and move up towards the $26, 2009 level highs.  That would be a nice 50-60% return if I'm right being bullish on the under-preforming financial sector. 


via StockCharts.com
"

Wednesday, April 20, 2011

A closer look at todays pop on the Dow.

The Dow managed to break the April 6 high of 12,450.93, giving further evidence to our bull market.  Next big resistance I see is the Feb 07 high of 12,770, and the 13,000 level.  RSI pointing to the sky doesn't hurt my conviction either.


via StockCharts.com
"

Tuesday, April 19, 2011

Hansen Medical, Inc. (HNSN)

Hansen medical, Inc is a producer of medical robots to aid in the treatment of patients with catheters.  For the past couple of weeks this stock has wanted to break through the upper resistance of $3.  Well today it did just that,  reaching a high of $3.39 before retracing down to the 200 EMA around $3.18, were it sits currently.  I think if this one can close today over $3, it could be the start of a nice uptrend.  I have my eye on the $5 level if it does.  This stock traded at $35 in 2007.

Monday, April 18, 2011

Cotton (BAL), Has this bull run out of steam?

Cotton ETF (BAL), hit a high of $117 this March.  I thought we were looking at a head in shoulders pattern at the end of March, but subsequently it rallied again in the beginning of April.  Today BAL closed back over it's 50 EMA.  Although still bias long, I think if we can't break through the $110 level we may be seeing a triple top.  A bit of a contrarian play in my opinion, but i will definitely be watching this one closer!  May signal the commodities bull coming to an end.

USDJPY, AUDUSD

USDJPY-Looking to short this, after break of 200 EMA.  Looking for this to test the major support area of 81.33.  Weekly chart shows a nice bounce off the 50 EMA

AUDUSD-Also looking to short this.  Seems like it can't bust through the high of 1.057, so i think it will pullback and test the1.205 support level
I got stopped out of my EURUSD long for -30 pips

Talecris Biotherapeutics Holdings Corp (TLCR)

Talecris Biotherapeutics (TLCR) has been a great stock, with a pending merger with South American based Grifols pending FTC approval.  I got in this one back in January as a merger arbitrage play, and boy has it worked out well for me!  Once approved Grifol's will pay $19 in cash and .624 common stock shares for each share of TLCR owned.  It's said to close sometime in June 2011 with a deal price around $30/share.  So, I think their is a little more upside left for this one.  But, I do see in the near term today's pullback possibly continuing to the $27.50 level before continuing upwards, maybe a good time to add or go long.  The RSI pointing down is a good sign of a potential pullback, but it's not quite in overbought territory.  Anyways I wouldn't fight this bull!

WellPoint, Inc. (WLP)

Wellpoint has been a great momentum trade for the past few months.  With the DOW dropping some 200 points today and the S&P 500 down 20 points.  I'm watching the $67 test of the 50 EMA.  Since WLP broke the 2010 high of $66 recently, I've been very bullish on this stock with an $80 price target.  If the $67 support breaks, it may test the $65 dollar level.  If a pullback manages to break through those levels in the next couple days, I'll say this bull has died.

Saturday, April 16, 2011

VIsa, Inc. (V)

I've been in Visa since the big drop back in December 2010.  I think the reaction to the debit/credit card swiping fees was way overdone, and on top I don't think they will effect Visa as much as the banks.  Since December Visa has broken the 200 EMA twice, the most recent cross being this April.  Recently the 50 EMA crossed the 100 EMA, and I think this is a start to a larger uptrend.  If V can break the $77 resistance and then break through the December 2010 top around $80, we might be looking upwards at $$95.

I will be watching $77 and $80 levels closely

Reading List Summer 2011

Here are some book that I really want to get my hands on and read over this summer.

You Can Be a Stock Market Genius: Uncover the Secret Hiding Places of Stock Market Profits
By: Joel Greenblatt
-Highlights special situations in the stock market.  Mergers, spinoffs, risk arbitrage, and many others to take advantage of.

Hedge Hunters: Hedge Fund Masters on the Rewards, the Risk, and the Reckoning
By:Katherine Burton
-Katherine offers an inside look into the top hedge fund managers back ground and personalities.

The Dow Theory (Fraser Publishing Library)
By: Robert Rhea
-Insight by Robert Rhea on the Dow Theory based on interpretations from Charles Dow and William Hamilton.

China Mediaexpress Holdings, Inc (CCME)

CCME another one of those Chineses RTO's that were too good to be true.  Check this out:
Notice the after hours trading! $17/share up some 43%.  This might be the answers to my nightmare on this stock, it has been a giant headache.  But I'm not going to jump to any conclusions, probably just another Yahoo! Finance glitch.

A Look At The Dow Jones

The Dow looks poised to jump up off of the 50 day EMA.  Still bullsih

Forex Analysis

EURUSD- I'm still long EURUSD from the 1.4295 breakout of November 2010.  I'm looking for the 1.4600 area, but I'm a little worried about the price action right now, it seems to be flirting with January 2010 high resistance. 

USDJPY- USDJPY looks prime for a long position right now.  Its right at the 200 day EMA, and the 50% retracement fib level. I'm going to be watching this pair closely. Tomorrow should be interesting.

I'm still trying to get charts up.

Friday, April 15, 2011

Riding the Gamestop Momentum (GME)

I found Gamestop 
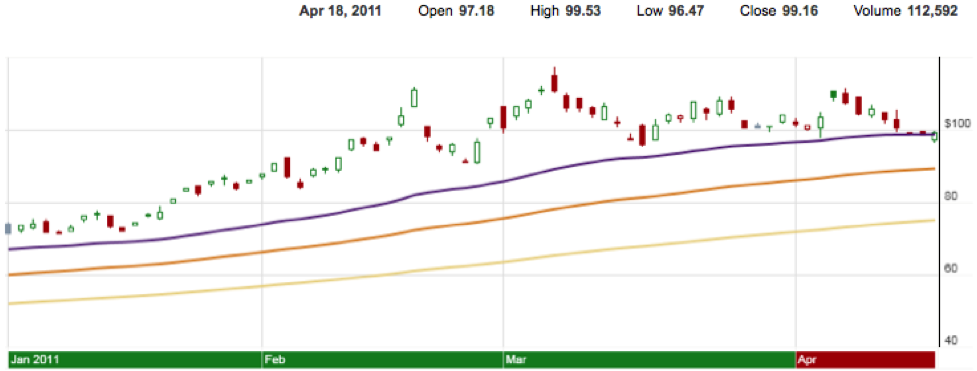
(GME) playing around with Scottrades technical analysis screener.  My only input were that the 100 EMA was crossed above the 200 EMA over the previous week. Not only were all three 50/100/200 EMA's crossed above each other, Game stop saw a nice breakout of the April 2010 highs.  I'm a gamer at heart so i didn't need to look into their business model, becasue i have been apart of it for many years.
I love to play around with the Ben Graham Fair value number.

Fair Value of a Stock= Squart root (22.5 X BVPS X EPS)

Gamestop's numbers.

Total Equity = $2,897,000,000
Total Shares Outstanding = 146,000,000
BVPS= $19.843
EPS = $2.65

FV = SQRT(22.5 X $19.843 X $2.65) = $34.40

With a current market price $26.40, that means 30.3% upside potential.  That $34.40 number is very close to the April 2009 high of $32.42.  I'll be watching the $27-$28 levels to see if this move can last!

I think if it breaks $32, we could be thinking about a $40 GME, which sounds good to me. 

Let's hope I'm right on this one, but earnings season will be tell-tale, and my bullish sentiment might reverse.